DORA - Failed Deployment Recovery Time
What is this metric?
The time of changes that were made to a code that then resulted in incidents, rollbacks, or any type of production failure.
Why is it important?
This metric is crucial in evaluating the resilience and efficiency of a team's deployment process. A shorter recovery time indicates a team's ability to swiftly detect issues, troubleshoot them, and restore the system to a functional state, minimizing downtime and impact on end-users.
Which dashboard(s) does it exist in
DORA dashboard. See live demo.
How is it calculated?
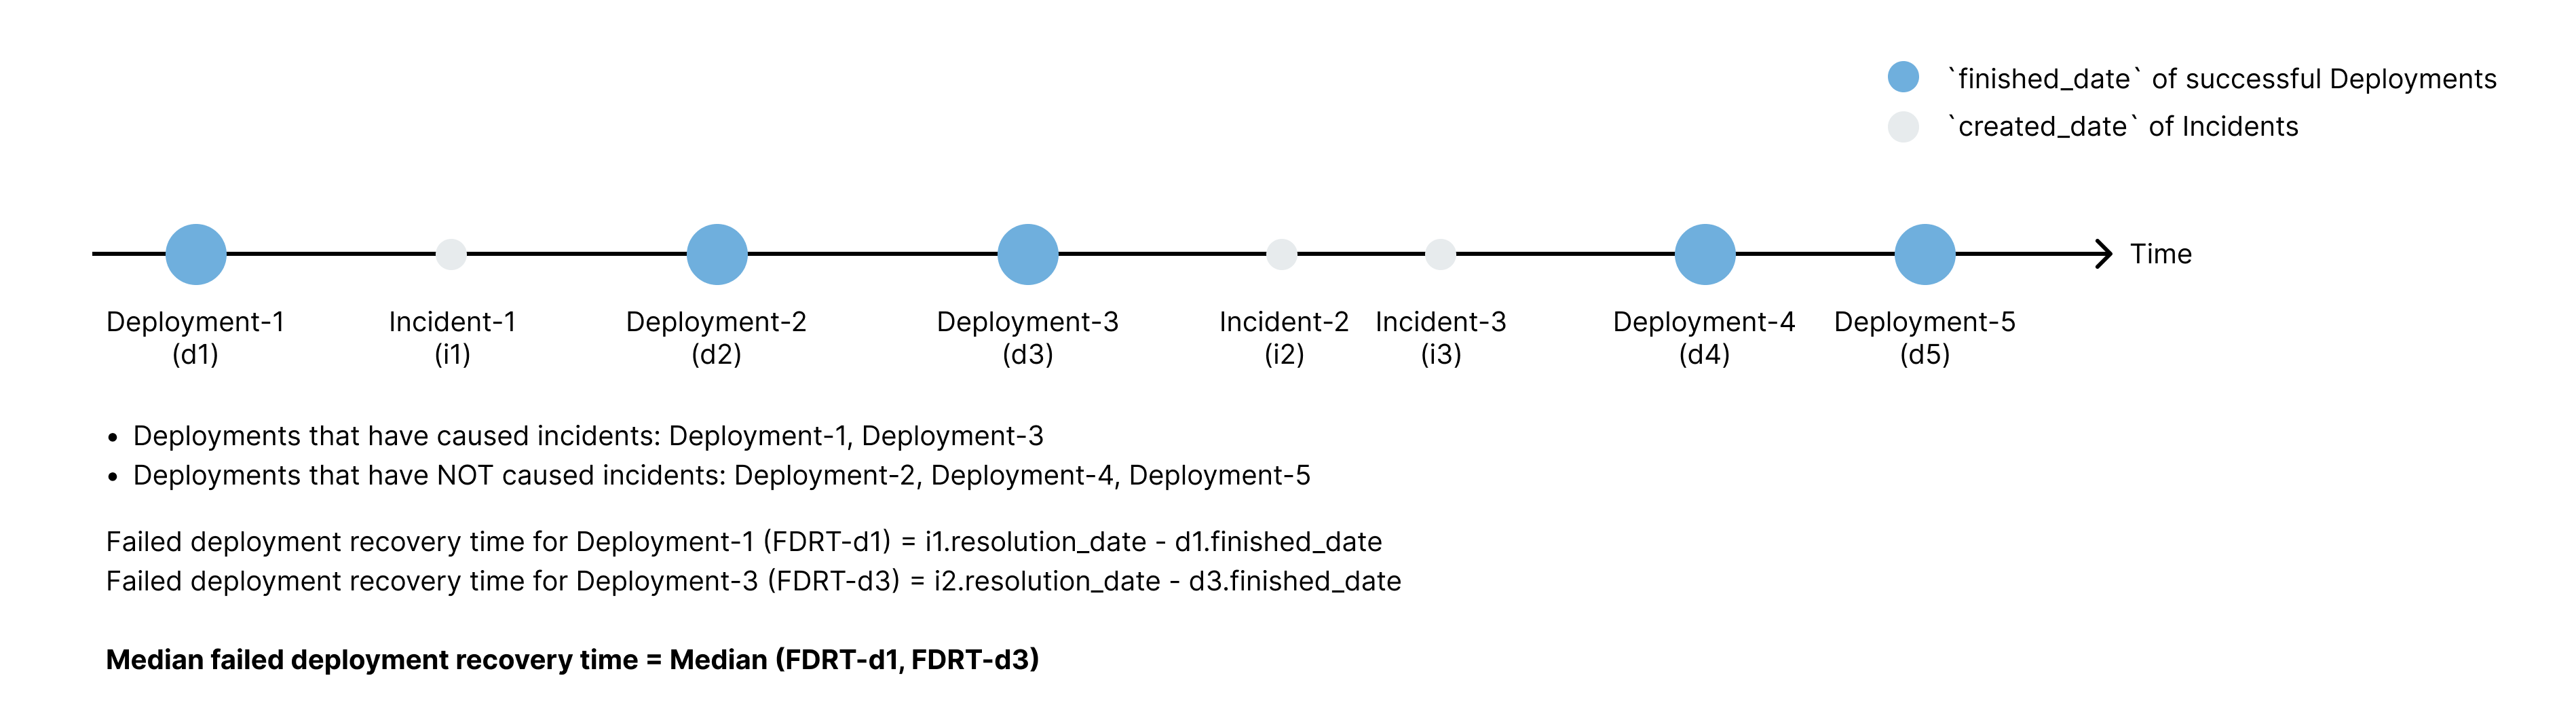
The time from deployment to the incident corresponding to deployment is resolved. For example, if a deployment finishes at 10:00 AM and causes an incident at 10:20. Then, the incident gets resolved at 11:00 AM. The failed deployment recovery time is one hour.
Below are the 2023 DORA benchmarks for different development teams from Google's report. However, it's difficult to tell which group a team falls into when the team's failed deployment recovery time is between one week and six months. Therefore, DevLake provides its own benchmarks to address this problem:
| Groups | Benchmarks | DevLake Benchmarks |
|---|---|---|
| Elite performers | Less than one hour | Less than one hour |
| High performers | Less than one day | Less than one day |
| Medium performers | Between one day and one week | Between one day and one week |
| Low performers | More than six months | More than one week |
Source: 2023 Accelerate State of DevOps, Google
Data Sources RequiredDeploymentsfrom Jenkins, GitLab CI, GitHub Action, BitBucket Pipelines, Webhook, etc.Incidentsfrom Jira issues, GitHub issues, TAPD issues, PagerDuty Incidents, Webhook, etc.
Define deployment and incident in data transformations while configuring the blueprint of a project to let DevLake know what CI/issue records can be regarded as deployments or incidents.
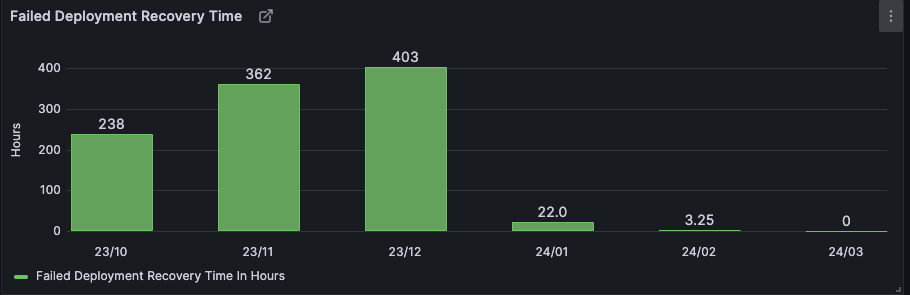
If you want to measure the monthly trend of the Failed Deployment Recovery Time as the picture shown below, run the following SQL in Grafana.
--  ***** 2023 report ***** --
--  Metric 4: Failed deployment recovery time
with _deployments as (
    SELECT
        cdc.cicd_deployment_id as deployment_id,
        max(cdc.finished_date) as deployment_finished_date
    FROM
        cicd_deployment_commits cdc
        JOIN project_mapping pm on cdc.cicd_scope_id = pm.row_id and pm.`table` = 'cicd_scopes'
    WHERE
        pm.project_name in ($project)
        and cdc.result = 'SUCCESS'
        and cdc.environment = 'PRODUCTION'
    GROUP BY 1
    HAVING $__timeFilter(max(cdc.finished_date))
),

_incidents_for_deployments as (
    SELECT
        i.id as incident_id,
        i.created_date as incident_create_date,
        i.resolution_date as incident_resolution_date,
        fd.deployment_id as caused_by_deployment,
        fd.deployment_finished_date,
        date_format(fd.deployment_finished_date,'%y/%m') as deployment_finished_month
    FROM
        issues i
        left join project_issue_metrics pim on i.id = pim.id
        join _deployments fd on pim.deployment_id = fd.deployment_id
    WHERE
        i.type = 'INCIDENT'
    and $__timeFilter(i.resolution_date)
),

_recovery_time_ranks as (
    SELECT *, percent_rank() over(PARTITION BY deployment_finished_month order by TIMESTAMPDIFF(MINUTE, deployment_finished_date, incident_resolution_date)) as ranks
    FROM _incidents_for_deployments
),

_median_recovery_time as (
    SELECT deployment_finished_month, max(TIMESTAMPDIFF(MINUTE, deployment_finished_date, incident_resolution_date)) as median_recovery_time
    FROM _recovery_time_ranks
    WHERE ranks <= 0.5
    GROUP BY deployment_finished_month
),

_metric_recovery_time_2023_report as (
    SELECT
    cm.month,
    case
        when m.median_recovery_time is null then 0
        else m.median_recovery_time/60
        end as median_recovery_time_in_hour
    FROM
    calendar_months cm
    LEFT JOIN _median_recovery_time m on cm.month = m.deployment_finished_month
    WHERE $__timeFilter(cm.month_timestamp)
)

SELECT
  cm.month,
  CASE
    WHEN '${dora_report}' = '2023' THEN mrt.median_recovery_time_in_hour
  END AS '${title_value} In Hours'
FROM
  calendar_months cm
  LEFT JOIN _metric_recovery_time_2023_report mrt ON cm.month = mrt.month
WHERE
  $__timeFilter(cm.month_timestamp)
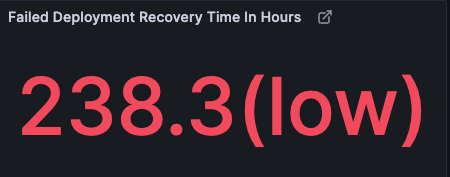
If you want to measure in which category your team falls into as in the picture shown below, run the following SQL in Grafana.
--  ***** 2023 report ***** --
--  Metric 4: Failed deployment recovery time
with _deployments as (
    SELECT
        cdc.cicd_deployment_id as deployment_id,
        max(cdc.finished_date) as deployment_finished_date
    FROM
        cicd_deployment_commits cdc
        JOIN project_mapping pm on cdc.cicd_scope_id = pm.row_id and pm.`table` = 'cicd_scopes'
    WHERE
        pm.project_name in ($project)
        and cdc.result = 'SUCCESS'
        and cdc.environment = 'PRODUCTION'
    GROUP BY 1
    HAVING $__timeFilter(max(cdc.finished_date))
),

_incidents_for_deployments as (
    SELECT
        i.id as incident_id,
        i.created_date as incident_create_date,
        i.resolution_date as incident_resolution_date,
        fd.deployment_id as caused_by_deployment,
        fd.deployment_finished_date,
        date_format(fd.deployment_finished_date,'%y/%m') as deployment_finished_month
    FROM
        issues i
        left join project_issue_metrics pim on i.id = pim.id
        join _deployments fd on pim.deployment_id = fd.deployment_id
    WHERE
        i.type = 'INCIDENT'
    and $__timeFilter(i.resolution_date)
),

_recovery_time_ranks as (
    SELECT *, percent_rank() over(order by TIMESTAMPDIFF(MINUTE, deployment_finished_date, incident_resolution_date)) as ranks
    FROM _incidents_for_deployments
),

_median_recovery_time as (
    SELECT max(TIMESTAMPDIFF(MINUTE, deployment_finished_date, incident_resolution_date)) as median_recovery_time
    FROM _recovery_time_ranks
    WHERE ranks <= 0.5
),

_metric_recovery_time_2023_report as(
    SELECT
    CASE
        WHEN ('$dora_report') = '2023' THEN
        CASE
            WHEN median_recovery_time < 60 THEN  CONCAT(round(median_recovery_time/60,1), "(elite)")
            WHEN median_recovery_time < 24 * 60 THEN CONCAT(round(median_recovery_time/60,1), "(high)")
            WHEN median_recovery_time < 7 * 24 * 60 THEN CONCAT(round(median_recovery_time/60,1), "(medium)")
            WHEN median_recovery_time >= 7 * 24 * 60 THEN CONCAT(round(median_recovery_time/60,1), "(low)")
            ELSE "N/A. Please check if you have collected incidents."
        END
    END AS median_recovery_time
    FROM
    _median_recovery_time
)

SELECT
  median_recovery_time AS median_time_in_hour
FROM
  _metric_recovery_time_2023_report
WHERE
  ('$dora_report') = '2023'
How to improve?
- Add unit tests for all new feature
- "Shift left", start QA early and introduce more automated tests
- Enforce code review if it is not strictly executed
- Improve your user support workflow to cope with incidents more efficiently