Deleted Lines of Code
What is this metric?
The accumulated number of deleted lines of code.
Why is it important?
- identify potential bottlenecks that may affect the output
- Encourage the team to implement a development model that matches the business requirements; develop excellent coding habits
Which dashboard(s) does it exist in
N/A
How is it calculated?
This metric is calculated by summing the deletions of commits in the given data range.
Data Sources RequiredThis metric relies on commits collected from GitHub, GitLab or BitBucket.
N/A
SQL QueriesThe following SQL shows how to find the deleted lines of code in specific repositories, eg. 'repo-1' and 'repo-2'.
SELECT
  sum(c.deletions) as deleted_lines_of_code
FROM
  commits c
  LEFT JOIN repo_commits rc ON c.sha = rc.commit_sha
  LEFT JOIN repos r ON r.id = rc.repo_id
WHERE
  -- please replace the repo ids with your own, or create a '$repo_id' variable in Grafana
  r.id in ('repo-1','repo-2')
  and message not like '%Merge%'
  and $__timeFilter(c.authored_date)
  -- the following condition will remove the month with incomplete data
  and c.authored_date >= DATE_ADD(DATE_ADD($__timeFrom(), INTERVAL -DAY($__timeFrom())+1 DAY), INTERVAL +1 MONTH)
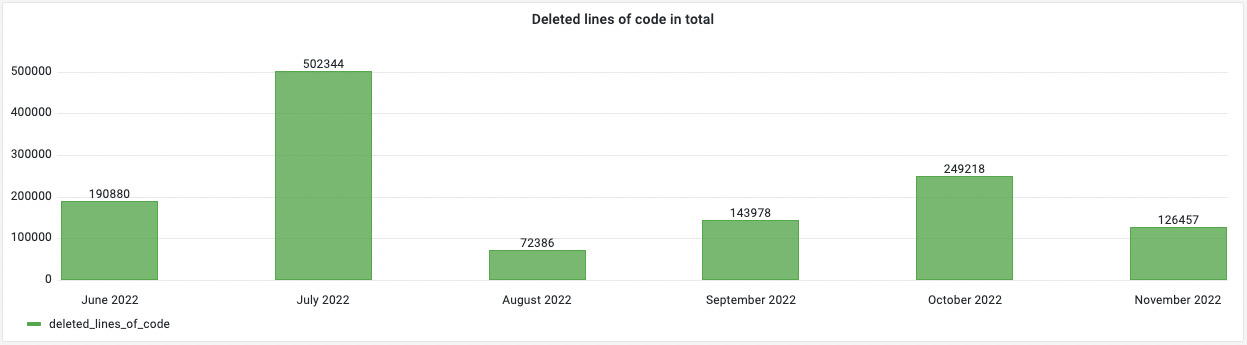
If you want to measure the monthly trend of deleted lines of code in the screenshot below, please run the following SQL in Grafana.
with _commits as(
  SELECT
    DATE_ADD(date(authored_date), INTERVAL -DAY(date(authored_date))+1 DAY) as time,
    sum(deletions) as deleted_lines_of_code
  FROM commits
  WHERE
    message not like '%Merge%'
    and $__timeFilter(authored_date)
    -- the following condition will remove the month with incomplete data
    and authored_date >= DATE_ADD(DATE_ADD($__timeFrom(), INTERVAL -DAY($__timeFrom())+1 DAY), INTERVAL +1 MONTH)
  group by 1
)

SELECT
  date_format(time,'%M %Y') as month,
  deleted_lines_of_code
FROM _commits
ORDER BY time
How to improve?
- From the project/team dimension, observe the accumulated change in Added lines to assess the team activity and code growth rate
- From version cycle dimension, observe the active time distribution of code changes, and evaluate the effectiveness of project development model.
- From the member dimension, observe the trend and stability of code output of each member, and identify the key points that affect code output by comparison.