DORA - Change Failure Rate
What is this metric?
The percentage of changes that were made to a code that then resulted in incidents, rollbacks, or any type of production failure.
Why is it important?
Unlike Deployment Frequency and Lead Time for Changes that measure the throughput, Change Failure Rate measures the stability and quality of software delivery. A low CFR reflects a bad end-user experience as the production failure is relatively high.
Which dashboard(s) does it exist in
DORA dashboard. See live demo.
How is it calculated?
The number of failures per the number of deployments. For example, if there are five deployments in a day and one causes a failure, that is a 20% change failure rate.
Below are the benchmarks for different development teams from Google's report. However, it's difficult to tell which group a team falls into when the team's change failure rate is 18% or 40%. Therefore, DevLake provides its own benchmarks to address this problem:
| Groups | Benchmarks | DevLake Benchmarks |
|---|---|---|
| Elite performers | 0%-15% | 0%-15% |
| High performers | 16%-30% | 16-20% |
| Medium performers | 16%-30% | 21%-30% |
| Low performers | 16%-30% | > 30% |
Source: 2021 Accelerate State of DevOps, Google
Data Sources RequiredThis metric relies on:
Deploymentscollected in one of the following ways:- Open APIs of Jenkins, GitLab, GitHub, etc.
- Webhook for general CI tools.
- Releases and PR/MRs from GitHub, GitLab APIs, etc.
Incidentscollected in one of the following ways:- Issue tracking tools such as Jira, TAPD, GitHub, etc.
- Incident or Service Monitoring tools such as PagerDuty, ServiceNow, etc.
This metric relies on:
- Deployment configuration in Jenkins, GitLab or GitHub transformation rules to let DevLake know what CI builds/jobs can be regarded as
Deployments. - Incident configuration in Jira, GitHub or TAPD transformation rules to let DevLake know what CI builds/jobs can be regarded as
Incidents.
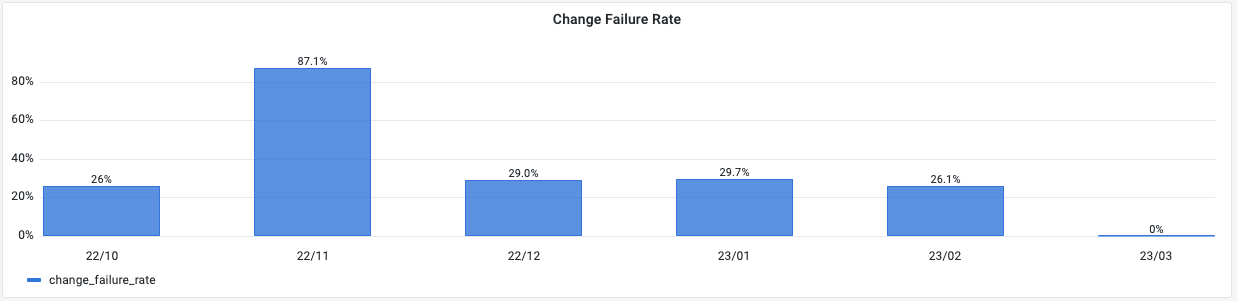
If you want to measure the monthly trend of change failure rate as the picture shown below, run the following SQL in Grafana.
with _deployments as (
-- get the deployment count each month
    SELECT
        date_format(finished_date,'%y/%m') as month,
        COUNT(distinct id) AS deployment_count
    FROM
        cicd_tasks
    WHERE
        type = 'DEPLOYMENT'
        and result = 'SUCCESS'
    GROUP BY 1
),

_incidents as (
-- get the incident count each month
    SELECT
        date_format(created_date,'%y/%m') as month,
        COUNT(distinct id) AS incident_count
    FROM
        issues
    WHERE
        type = 'INCIDENT'
    GROUP BY 1
),

_calendar_months as(
-- deal with the month with no incidents
    SELECT date_format(CAST((SYSDATE()-INTERVAL (month_index) MONTH) AS date), '%y/%m') as month
    FROM ( SELECT 0 month_index
            UNION ALL SELECT   1  UNION ALL SELECT   2 UNION ALL SELECT   3
            UNION ALL SELECT   4  UNION ALL SELECT   5 UNION ALL SELECT   6
            UNION ALL SELECT   7  UNION ALL SELECT   8 UNION ALL SELECT   9
            UNION ALL SELECT   10 UNION ALL SELECT  11
        ) month_index
    WHERE (SYSDATE()-INTERVAL (month_index) MONTH) > SYSDATE()-INTERVAL 6 MONTH
)

SELECT
    cm.month,
    case
        when d.deployment_count is null or i.incident_count is null then 0
        else i.incident_count/d.deployment_count end as change_failure_rate
FROM
    _calendar_months cm
    left join _incidents i on cm.month = i.month
    left join _deployments d on cm.month = d.month
ORDER BY 1
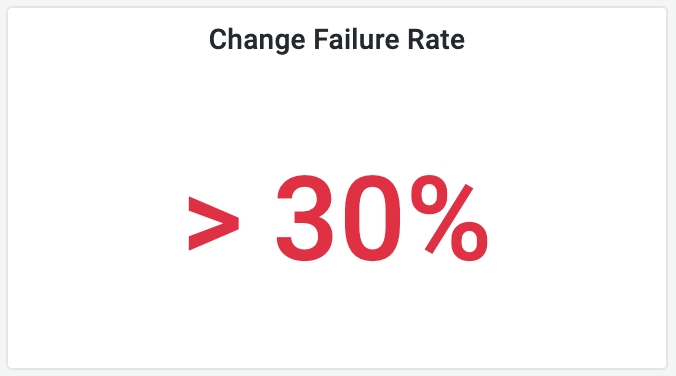
If you want to measure in which category your team falls into as the picture shown below, run the following SQL in Grafana.
with _deployment_count as (
-- get the deployment deployed within the selected time period in the top-right corner
    SELECT
        COUNT(distinct id) AS deployment_count
    FROM
        cicd_tasks
    WHERE
        type = 'DEPLOYMENT'
        and result = 'SUCCESS'
    and $__timeFilter(finished_date)
),

_incident_count as (
-- get the incident created within the selected time period in the top-right corner
    SELECT
        COUNT(distinct id) AS incident_count
    FROM
        issues
    WHERE
        type = 'INCIDENT'
        and $__timeFilter(created_date)
)

SELECT
    case
        when deployment_count is null or incident_count is null or deployment_count = 0 then NULL
        when incident_count/deployment_count <= .15 then "0-15%"
        when incident_count/deployment_count <= .20 then "16%-20%"
        when incident_count/deployment_count <= .30 then "21%-30%"
        else "> 30%"
        end as change_failure_rate
FROM
    _deployment_count, _incident_count
How to improve?
- Add unit tests for all new feature
- "Shift left", start QA early and introduce more automated tests
- Enforce code review if it's not strictly executed