Bug Count per 1k Lines of Code
What is this metric?
Amount of bugs per 1,000 lines of code.
Why is it important?
- Defect drill-down analysis to inform the development of design and code review strategies and to improve the internal QA process
- Assist teams to locate projects/modules with higher defect severity and density, and clean up technical debts
- Identify good/to-be-improved practices that affect defect count or defect rate, to reduce the number of future defects
Which dashboard(s) does it exist in
N/A
How is it calculated?
The number of bugs divided by the total accumulated lines of code (additions + deletions) in the given data range.
Data sources requiredissuescollected from Jira, GitHub or TAPD.commitscollected from GitHub, GitLab or BitBucket.
This metric relies on the 'type-bug' configuration in Jira, GitHub or TAPD's transformation rules while adding/editing a blueprint. This configuration tells DevLake what issues are bugs.
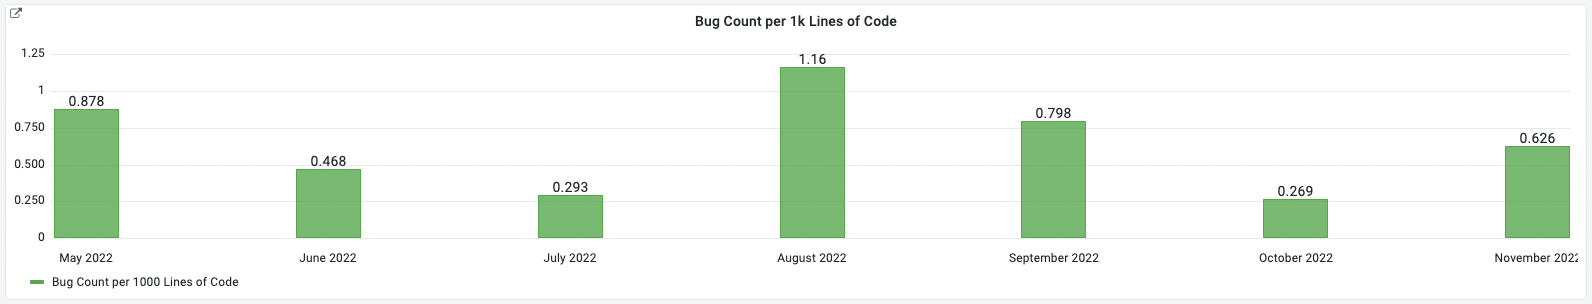
If you want to measure the monthly trend of Bugs per 1k lines of code in the screenshot below, please run the following SQL in Grafana.
with _line_of_code as (
    select
      DATE_ADD(date(authored_date), INTERVAL -DAY(date(authored_date))+1 DAY) as time,
      sum(additions + deletions) as line_count
    from
      commits
    where
      message not like 'Merge%'
      and $__timeFilter(authored_date)
    group by 1
),


_bug_count as(
  select
    DATE_ADD(date(created_date), INTERVAL -DAY(date(created_date))+1 DAY) as time,
    count(*) as bug_count
  from issues i
  where
    type = 'Bug'
    and $__timeFilter(created_date)
  group by 1
),


_bug_count_per_1k_loc as(
  select
    loc.time,
    1.0 * bc.bug_count / loc.line_count * 1000 as bug_count_per_1k_loc
  from
    _line_of_code loc
    left join _bug_count bc on bc.time = loc.time
  where
    bc.bug_count is not null
    and loc.line_count is not null
    and loc.line_count != 0
)

select
  date_format(time,'%M %Y') as month,
  bug_count_per_1k_loc as 'Bug Count per 1000 Lines of Code'
from _bug_count_per_1k_loc
order by time;
How to improve?
- From the project or team dimension, observe the statistics on the total number of defects, the distribution of the number of defects in each severity level/type/owner, the cumulative trend of defects, and the change trend of the defect rate in thousands of lines, etc.
- From version cycle dimension, observe the statistics on the cumulative trend of the number of defects/defect rate, which can be used to determine whether the growth rate of defects is slowing down, showing a flat convergence trend, and is an important reference for judging the stability of software version quality
- From the time dimension, analyze the trend of the number of test defects, defect rate to locate the key items/key points
- Evaluate whether the software quality and test plan are reasonable by referring to CMMI standard values