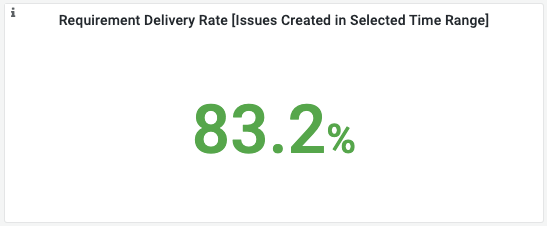
Requirement Delivery Rate
What is this metric?
The ratio of delivered requirements to all requirements.
Why is it important?
- Based on historical data, establish a baseline of the delivery capacity of a single iteration to improve the organization and planning of R&D resources.
- Evaluate whether the delivery capacity matches the business phase and demand scale. Identify key bottlenecks and reasonably allocate resources.
Which dashboard(s) does it exist in
How is it calculated?
The number of delivered requirements divided by the total number of requirements in the given data range.
Data Sources RequiredThis metric relies on the issues collected from Jira, GitHub, or TAPD.
This metric relies on the 'type-requirement' configuration in Jira, GitHub or TAPD's transformation rules while adding/editing a blueprint. This configuration tells DevLake what issues are requirements.
The following SQL shows how to find the requirement delivery rate in specific boards, eg. 'board-1' and 'board-2'.
WITH _requirements as(
  SELECT
    count(distinct i.id) as total_count,
    count(distinct case when i.status = 'DONE' then i.id else null end) as delivered_count
  FROM issues i
    join board_issues bi on i.id = bi.issue_id
  WHERE
    i.type = 'REQUIREMENT'
    and $__timeFilter(i.created_date)
    -- please replace the board ids with your own, or create a '$board_id' variable in Grafana
    and bi.board_id in ('board_1', 'board_2')
)

SELECT
  now() as time,
  1.0 * delivered_count/total_count as requirement_delivery_rate
FROM _requirements
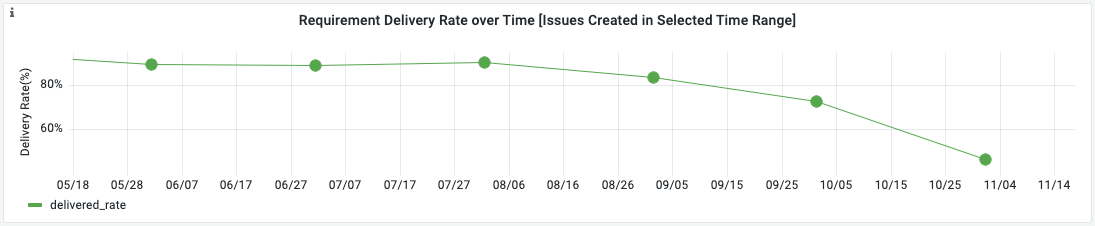
If you want to measure the monthly trend of requirement delivery rate in the screenshot below, please run the following SQL in Grafana.
WITH _requirements as(
  SELECT
    DATE_ADD(date(i.created_date), INTERVAL -DAYOFMONTH(date(i.created_date))+1 DAY) as time,
    1.0 * count(distinct case when i.status = 'DONE' then i.id else null end)/count(distinct i.id) as delivered_rate
  FROM issues i
    join board_issues bi on i.id = bi.issue_id
  WHERE
     i.type = 'REQUIREMENT'
    and $__timeFilter(i.created_date)
    -- please replace the board ids with your own, or create a '$board_id' variable in Grafana
    and bi.board_id in ($board_id)
  GROUP BY 1
)

SELECT
  time,
  delivered_rate
FROM _requirements
ORDER BY time
How to improve?
- Analyze the number of requirements and delivery rate of different time cycles to find the stability and trend of the development process.
- Analyze and compare the number of requirements delivered and delivery rate of each project/team, and compare the scale of requirements of different projects.
- Based on historical data, establish a baseline of the delivery capacity of a single iteration (optimistic, probable and pessimistic values) to provide a reference for iteration estimation.
- Drill down to analyze the number and percentage of requirements in different phases of SDLC. Analyze rationality and identify the requirements stuck in the backlog.