PR Merge Rate
What is this metric?
The ratio of PRs/MRs that get merged.
Why is it important?
- Code review metrics are process indicators to provide quick feedback on developers' code quality
- Promote the team to establish a unified coding specification and standardize the code review criteria
- Identify modules with low-quality risks in advance, optimize practices, and precipitate into reusable knowledge and tools to avoid technical debt accumulation
Which dashboard(s) does it exist in
- GitHub
- GitLab
- Weekly Community Retro
- Engineering Throughput and Cycle Time
- Engineering Throughput and Cycle Time - Team View
How is it calculated?
The number of merged PRs divided by the number of all PRs in the given data range.
Data Sources RequiredThis metric relies on PRs/MRs collected from GitHub, GitLab, BitBucket, Gitee or other code review tools.
Data Transformation RequiredN/A
SQL QueriesThe following SQL shows how to find the PR merged rate in specific repositories and given time range, eg. 'repo-1' and 'repo-2'.
select
    count(distinct case when merged_date is not null then id else null end)/count(*) as pr_merged_rate
from
    pull_requests pr
where
  -- $__timeFilter will take Grafana's time range
  $__timeFilter(created_date)
  -- please replace the repo ids with your own, or create a '$repo_id' variable in Grafana
    and base_repo_id in ('repo_1', 'repo_2')
  -- remove PRs submitted by bots, comment it out if you don't need it
  and author_name not rlike  '^robot-|-robot$|\\[bot\\]|-bot$|-ci$|-testing$'
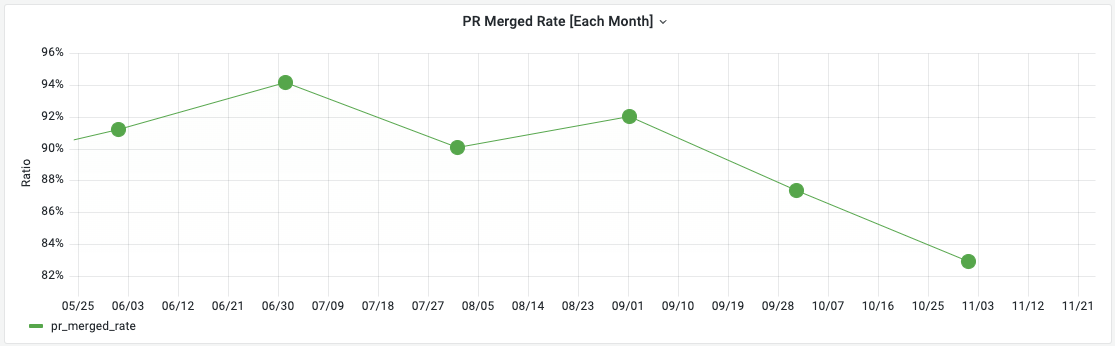
If you want to measure the monthly trend of PR merge rate in the screenshot below, please run the following SQL in Grafana.
SELECT
  DATE_ADD(date(created_date), INTERVAL -DAYOFMONTH(date(created_date))+1 DAY) as time,
  count(distinct case when merged_date is not null then id else null end)/count(*) as pr_merged_rate
FROM pull_requests
WHERE
  $__timeFilter(created_date)
  -- please replace the repo ids with your own, or create a '$repo_id' variable in Grafana
  and base_repo_id in ('repo_1', 'repo_2')
  -- remove PRs submitted by bots, comment it out if you don't need it
  and author_name not rlike  '^robot-|-robot$|\\[bot\\]|-bot$|-ci$|-testing$'
GROUP BY 1
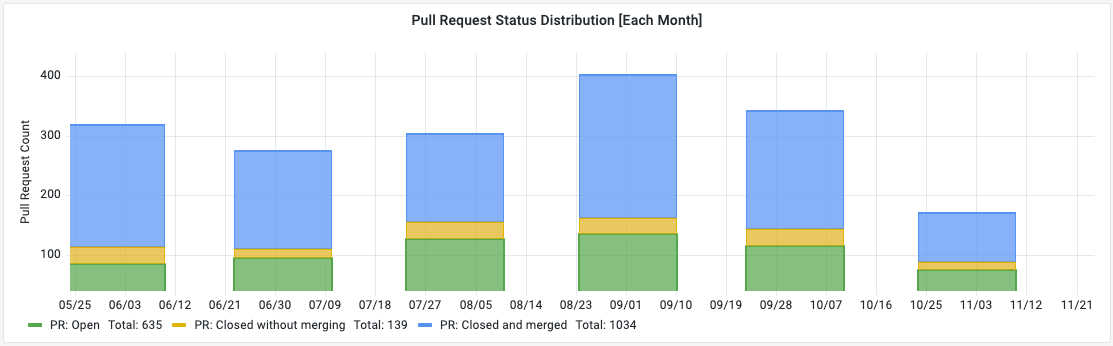
If you want to measure the monthly trend of PR status distribution, please run the following SQL in Grafana.
SELECT
  DATE_ADD(date(created_date), INTERVAL -DAYOFMONTH(date(created_date))+1 DAY) as time,
  count(distinct case when status != 'closed' then id else null end) as "PR: Open",
  count(distinct case when status = 'closed' and merged_date is null then id else null end) as "PR: Closed without merging",
  count(distinct case when status = 'closed' and merged_date is not null then id else null end) as "PR: Closed and merged"
FROM pull_requests
WHERE
  $__timeFilter(created_date)
  and created_date >= DATE_ADD(DATE_ADD($__timeFrom(), INTERVAL -DAY($__timeFrom())+1 DAY), INTERVAL +1 MONTH)
  and base_repo_id in ('repo_1', 'repo_2')
  -- remove PRs submitted by bots, comment it out if you don't need it
  and author_name not rlike  '^robot-|-robot$|\\[bot\\]|-bot$|-ci$|-testing$'
GROUP BY 1
How to improve?
- From the developer dimension, we evaluate the code quality of developers by combining the task complexity with the metrics related to the number of review passes and review rounds.
- From the reviewer dimension, we observe the reviewer's review style by taking into account the task complexity, the number of passes and the number of review rounds.
- From the project/team dimension, we combine the project phase and team task complexity to aggregate the metrics related to the number of review passes and review rounds, and identify the modules with abnormal code review process and possible quality risks.