Build Success Rate
What is this metric?
The ratio of successful builds to all builds.
Why is it important?
- As a process indicator, it reflects the value flow efficiency of upstream production and research links
- Identify excellent/to-be-improved practices that impact the build, and drive the team to precipitate reusable tools and mechanisms to build infrastructure for fast and high-frequency delivery
Which dashboard(s) does it exist in
How is it calculated?
The number of successful builds divided by the total number of builds in the given data range.
Data Sources RequiredThis metric relies on Jenkins builds, GitLab pipelines or GitHub workflow runs.
Data Transformation RequiredN/A
SQL QueriesThe following SQL shows how to find the success rate of CI builds finished in the given time range.
SELECT
  1.0 * sum(case when result = 'SUCCESS' then 1 else 0 end)/ count(*) as "Build Success Rate"
FROM
  cicd_pipelines
WHERE
  $__timeFilter(finished_date)
ORDER BY 1
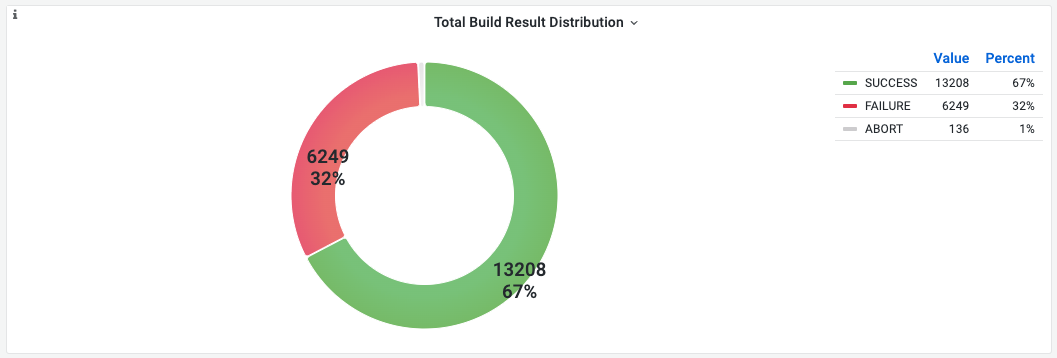
If you want to measure the distribution of CI build result like the donut chart below, please run the following SQL in Grafana.
SELECT
  result,
  count(*) as build_count
FROM
  cicd_pipelines
WHERE
  $__timeFilter(finished_date)
  and id like "%jenkins%"
  and name in ($job_id)
  -- the following condition will remove the month with incomplete data
  and finished_date >= DATE_ADD(DATE_ADD($__timeFrom(), INTERVAL -DAY($__timeFrom())+1 DAY), INTERVAL +1 MONTH)
GROUP BY 1
ORDER BY 2 DESC
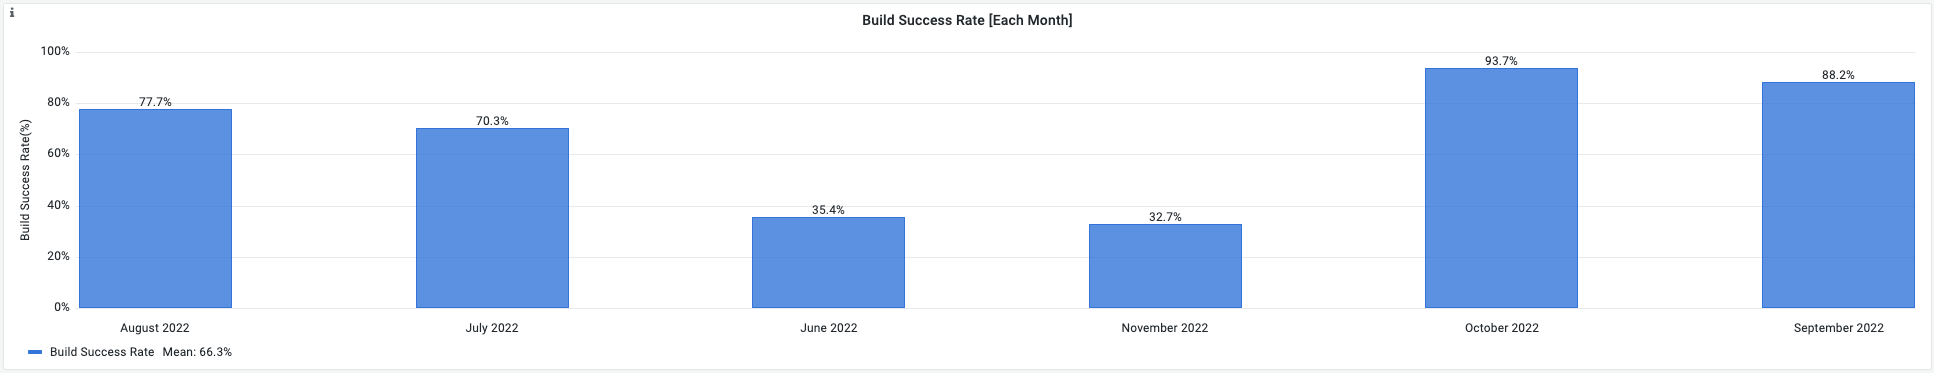
If you want to measure the mean build success rate per month in the screenshot below, please run the following SQL in Grafana.
WITH _build_success_rate as(
  SELECT
    DATE_ADD(date(finished_date), INTERVAL -DAYOFMONTH(date(finished_date))+1 DAY) as time,
    result
  FROM
    cicd_pipelines
  WHERE
    $__timeFilter(finished_date)
    -- the following condition will remove the month with incomplete data
    and finished_date >= DATE_ADD(DATE_ADD($__timeFrom(), INTERVAL -DAY($__timeFrom())+1 DAY), INTERVAL +1 MONTH)
)

SELECT
  date_format(time,'%M %Y') as month,
  1.0 * sum(case when result = 'SUCCESS' then 1 else 0 end)/ count(*) as "Build Success Rate"
FROM _build_success_rate
GROUP BY 1
ORDER BY 1
How to improve?
- From the project dimension, compare the number of builds and success rate by combining the project phase and the complexity of tasks.
- From the time dimension, analyze the trend of the number of builds and success rate to see if it has improved over time.