Grafana
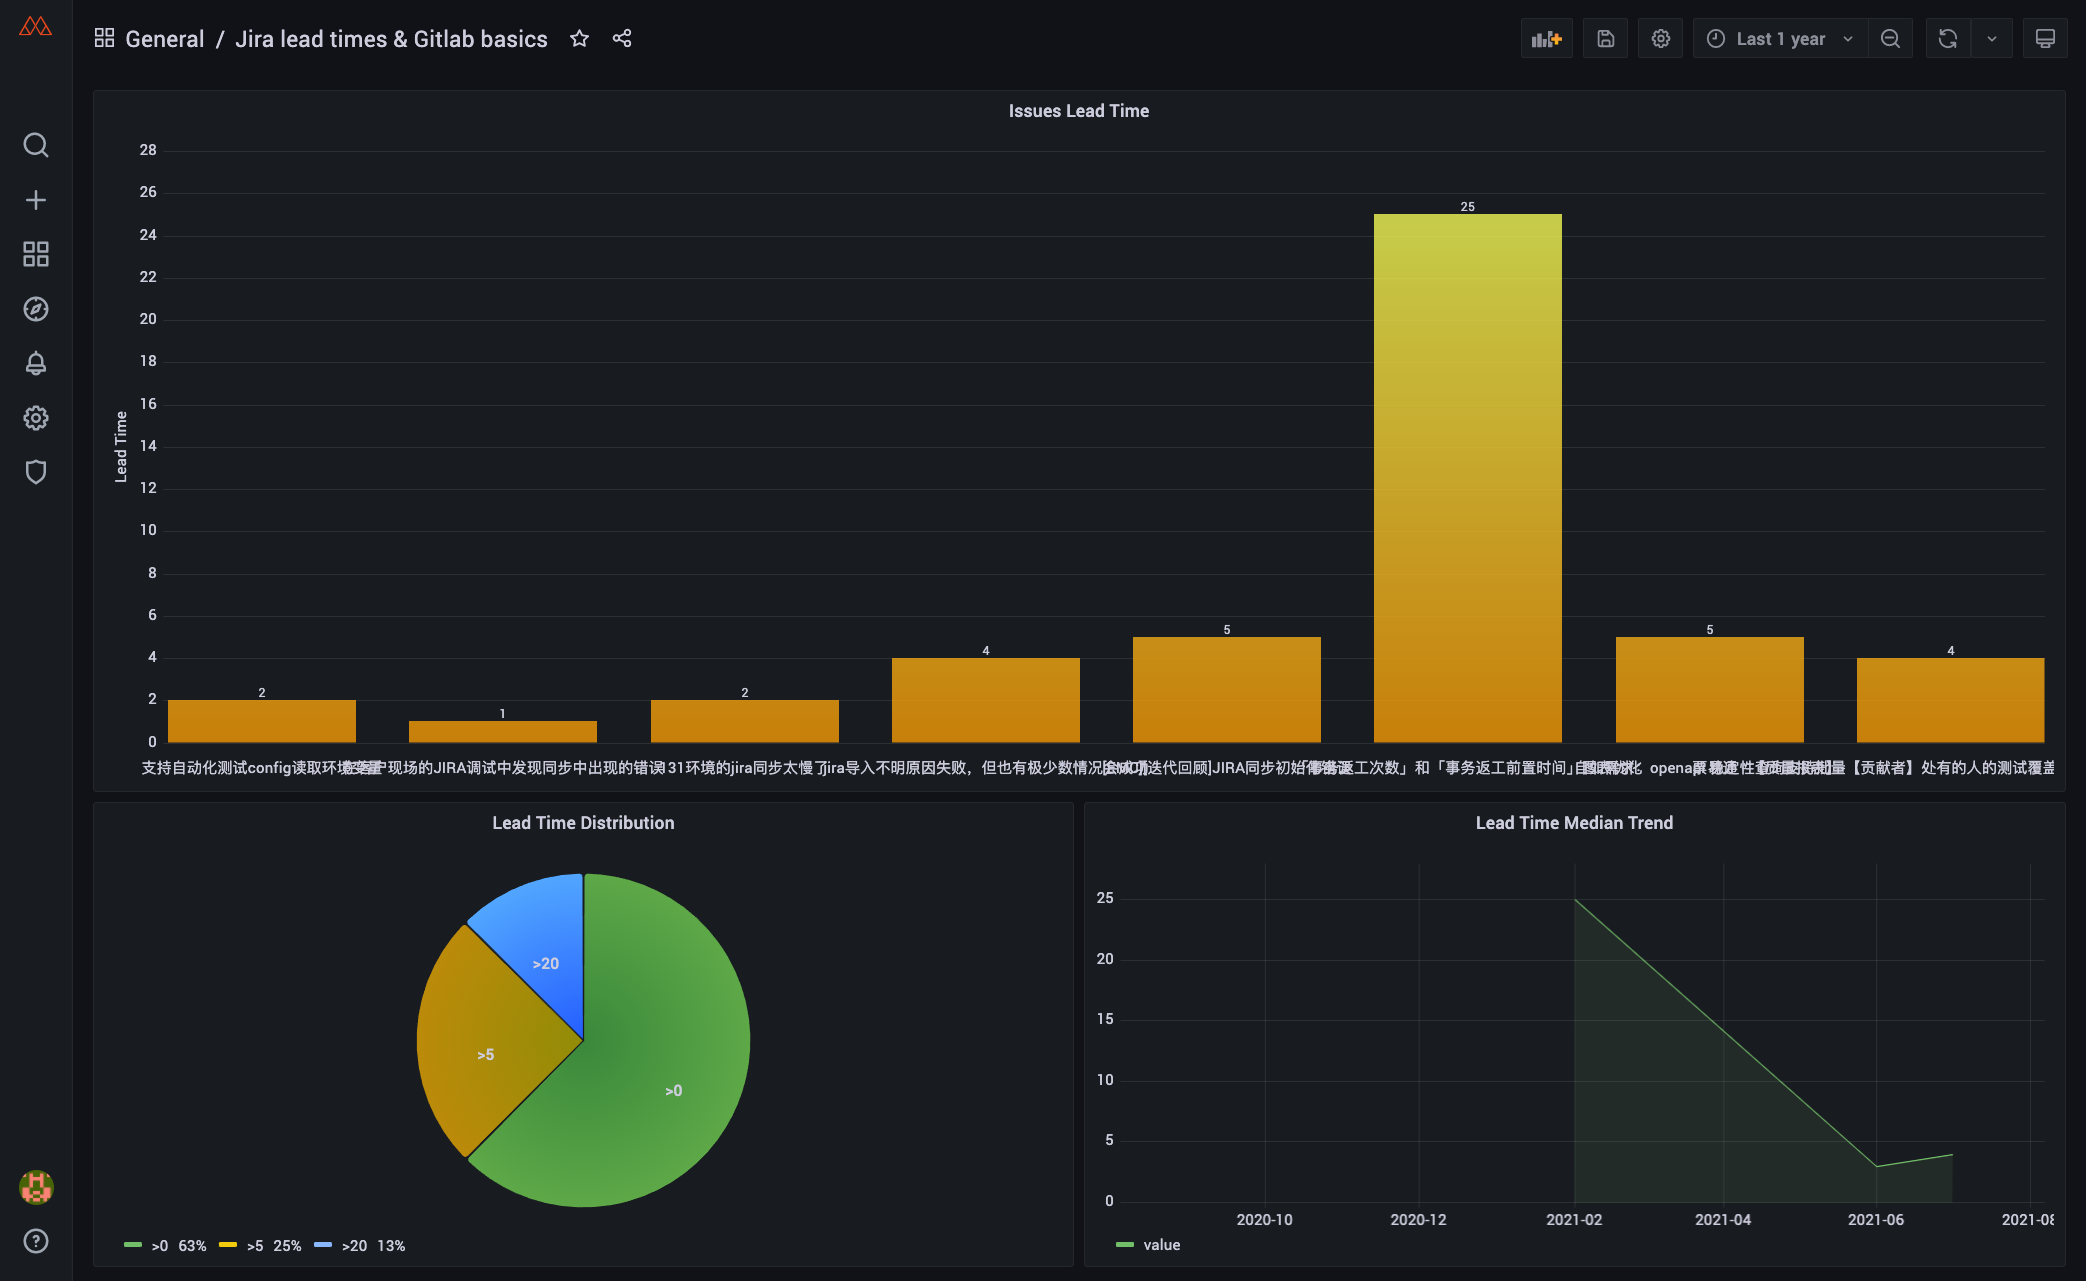
When first visiting Grafana, you will be provided with a sample dashboard with some basic charts setup from the database.
Contents
| Section | Link |
|---|---|
| Logging In | View Section |
| Viewing All Dashboards | View Section |
| Customizing a Dashboard | View Section |
| Dashboard Settings | View Section |
| Provisioning a Dashboard | View Section |
| Troubleshooting DB Connection | View Section |
Logging In
Once the app is up and running, visit http://localhost:3002 to view the Grafana dashboard.
Default login credentials are:
- Username:
admin - Password:
admin
Viewing All Dashboards
To see all dashboards created in Grafana visit /dashboards
Or, use the sidebar and click on Manage:

Customizing a Dashboard
When viewing a dashboard, click the top bar of a panel, and go to edit

Edit Dashboard Panel Page:

1. Preview Area
- Top Left is the variable select area (custom dashboard variables, used for switching projects, or grouping data)
- Top Right we have a toolbar with some buttons related to the display of the data:
- View data results in a table
- Time range selector
- Refresh data button
- The Main Area will display the chart and should update in real time
Note: Data should refresh automatically, but may require a refresh using the button in some cases
2. Query Builder
Here we form the SQL query to pull data into our chart, from our database
Ensure the Data Source is the correct database

Select Format as Table, and Edit SQL buttons to write/edit queries as SQL

The Main Area is where the queries are written, and in the top right is the Query Inspector button (to inspect returned data)

3. Main Panel Toolbar
In the top right of the window are buttons for:
- Dashboard settings (regarding entire dashboard)
- Save/apply changes (to specific panel)
4. Grafana Parameter Sidebar
- Change chart style (bar/line/pie chart etc)
- Edit legends, chart parameters
- Modify chart styling
- Other Grafana specific settings
Dashboard Settings
When viewing a dashboard click on the settings icon to view dashboard settings. Here are 2 important sections to use:

Variables
- Create variables to use throughout the dashboard panels, that are also built on SQL queries

JSON Model
- Copy
jsoncode here and save it to a new file in/grafana/dashboards/with a unique name in thelakerepo. This will allow us to persist dashboards when we load the app

- Copy
Provisioning a Dashboard
To save a dashboard in the lake repo and load it:
- Create a dashboard in browser (visit
/dashboard/new, or use sidebar) - Save dashboard (in top right of screen)
- Go to dashboard settings (in top right of screen)
- Click on JSON Model in sidebar
- Copy code into a new
.jsonfile in/grafana/dashboards
Troubleshooting DB Connection
To ensure we have properly connected our database to the data source in Grafana, check database settings in ./grafana/datasources/datasource.yml, specifically:
databaseusersecureJsonData/password
Troubleshooting
If you run into any problem, please check the Troubleshooting or create an issue