DORA - Lead Time for Changes
What is this metric?
The median amount of time for a commit to be deployed into production.
Why is it important?
This metric measures the time it takes to commit code to the production environment and reflects the speed of software delivery. A lower average change preparation time means that your team is efficient at coding and deploying your project.
Which dashboard(s) does it exist in
DORA dashboard. See live demo.
How is it calculated?
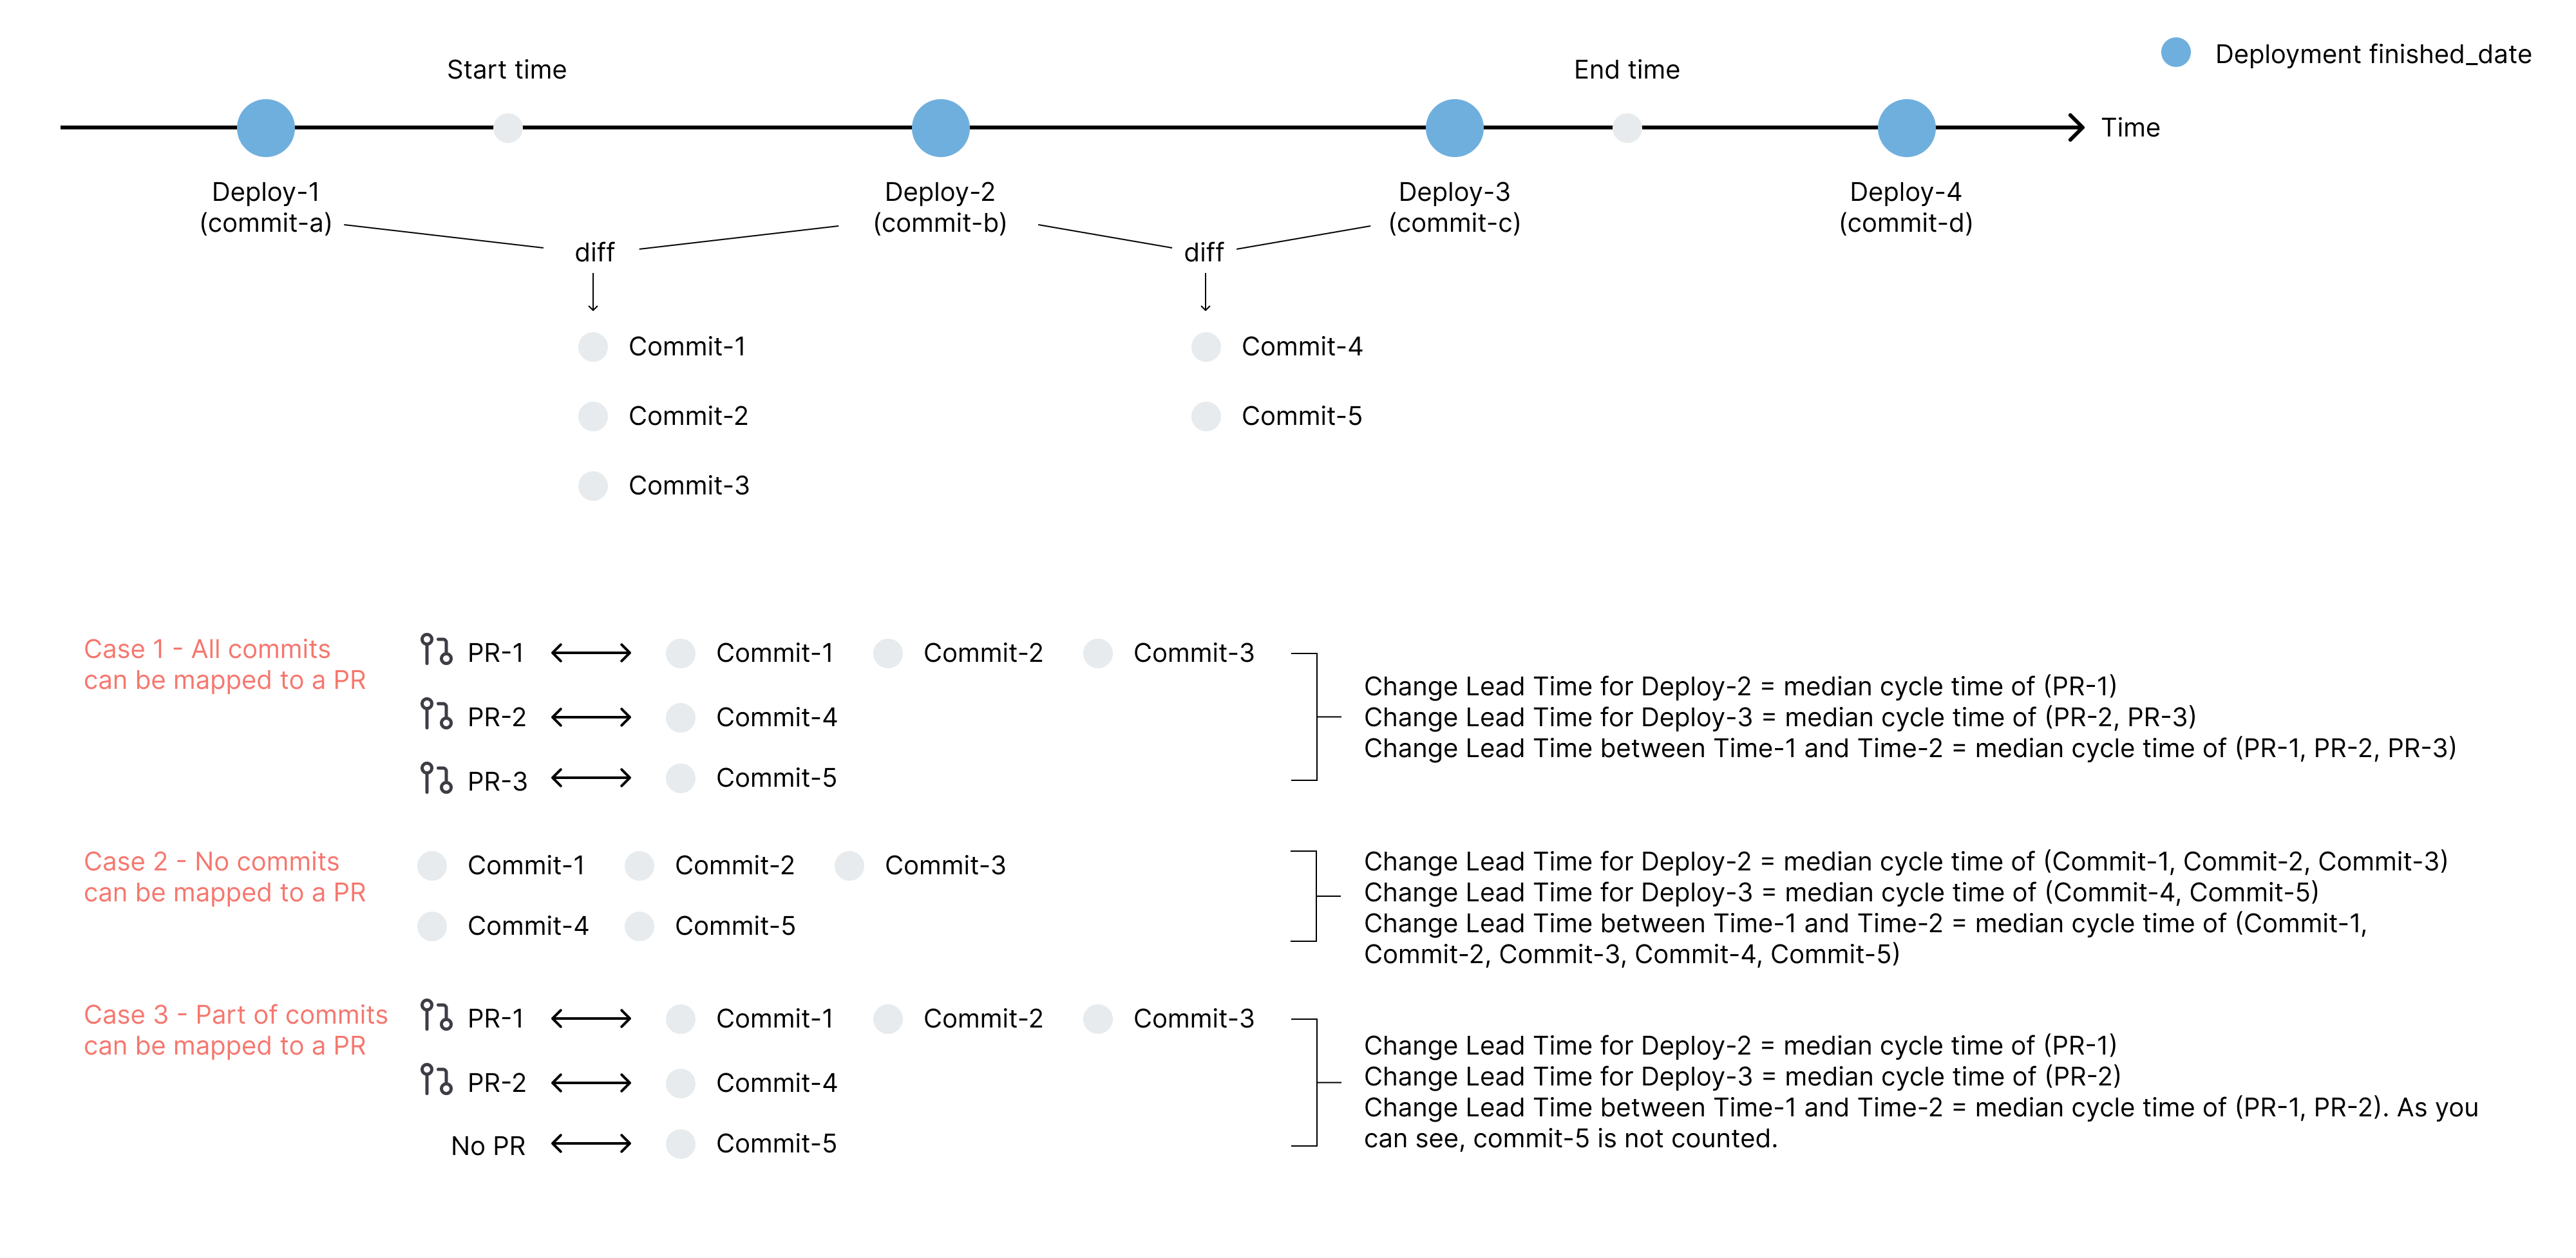
- Find the deployments whose finished_date falls into the time range that users select
- Calculate the commits diff between each deployment by deployments' commit_sha
- Find the PRs mapped to the commits in step 2, now we have the relation of Deployment - Deployed_commits - Deployed_PRs.
- Calculate PR Deploy Time by using finish_time of deployment minus merge_time of PR
PR cycle time is pre-calculated when dora plugin is triggered. You can connect to DevLake's database and find it in the field change_timespan in table.pull_requests.
Below are the benchmarks for different development teams from Google's report. However, it's difficult to tell which group a team falls into when the team's median lead time for changes is between one week and one month. Therefore, DevLake provides its own benchmarks to address this problem:
| Groups | Benchmarks | DevLake Benchmarks |
|---|---|---|
| Elite performers | Less than one hour | Less than one hour |
| High performers | Between one day and one week | Less than one week |
| Medium performers | Between one month and six months | Between one week and six months |
| Low performers | More than six months | More than six months |
Source: 2021 Accelerate State of DevOps, Google
Data Sources RequiredThis metric relies on deployments collected in multiple ways:
- Open APIs of Jenkins, GitLab, GitHub, etc.
- Webhook for general CI tools.
- Releases and PR/MRs from GitHub, GitLab APIs, etc.
This metric relies on the deployment configuration in Jenkins, GitLab or GitHub transformation rules to let DevLake know what CI builds/jobs can be regarded as deployments.
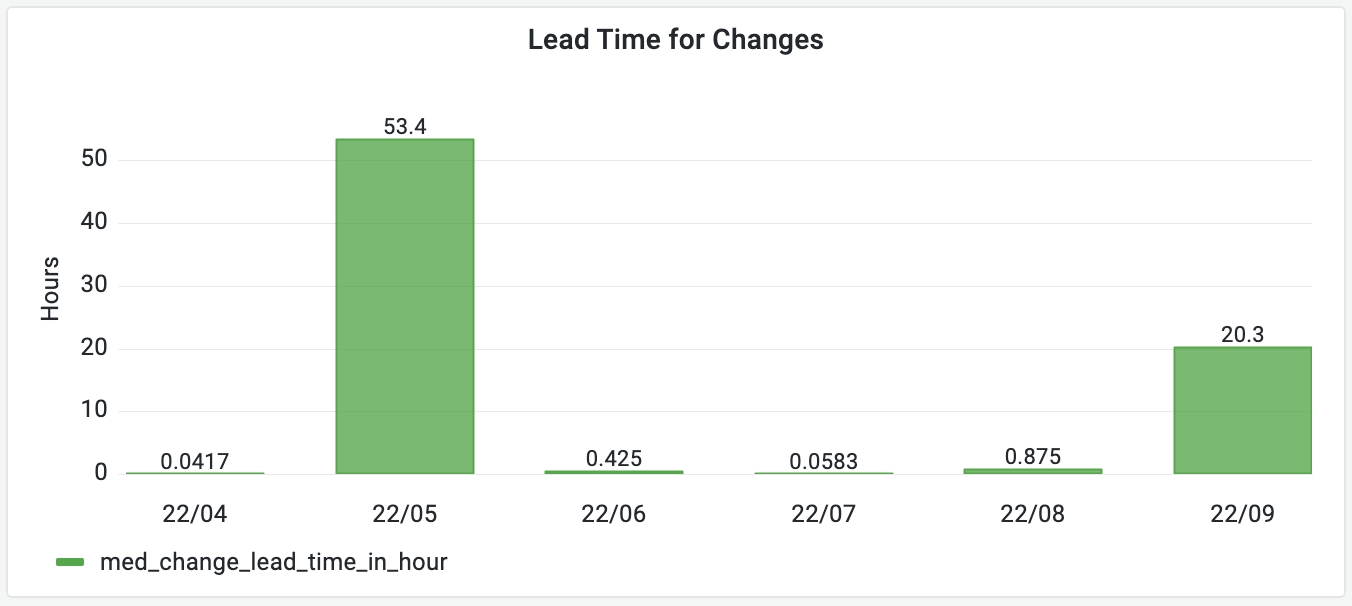
SQL QueriesIf you want to measure the monthly trend of median lead time for changes as the picture shown below, run the following SQL in Grafana.
with _pr_stats as (
-- get PRs' cycle lead time in each month
    SELECT
        pr.id,
        date_format(pr.merged_date,'%y/%m') as month,
        pr.change_timespan as pr_cycle_time
    FROM
        pull_requests pr
    WHERE
        pr.merged_date is not null
        and pr.change_timespan is not null
        and $__timeFilter(pr.merged_date)
),

_find_median_clt_each_month as (
    SELECT x.month, x.pr_cycle_time as med_change_lead_time
    FROM _pr_stats x JOIN _pr_stats y ON x.month = y.month
    GROUP BY x.month, x.pr_cycle_time
    HAVING SUM(SIGN(1-SIGN(y.pr_cycle_time-x.pr_cycle_time)))/COUNT(*) > 0.5
),

_find_clt_rank_each_month as (
    SELECT
        *,
        rank() over(PARTITION BY month ORDER BY med_change_lead_time) as _rank
    FROM
        _find_median_clt_each_month
),

_clt as (
    SELECT
        month,
        med_change_lead_time
    from _find_clt_rank_each_month
    WHERE _rank = 1
),

_calendar_months as(
-- to deal with the month with no incidents
    SELECT date_format(CAST((SYSDATE()-INTERVAL (month_index) MONTH) AS date), '%y/%m') as month
    FROM ( SELECT 0 month_index
            UNION ALL SELECT   1  UNION ALL SELECT   2 UNION ALL SELECT   3
            UNION ALL SELECT   4  UNION ALL SELECT   5 UNION ALL SELECT   6
            UNION ALL SELECT   7  UNION ALL SELECT   8 UNION ALL SELECT   9
            UNION ALL SELECT   10 UNION ALL SELECT  11
        ) month_index
    WHERE (SYSDATE()-INTERVAL (month_index) MONTH) > SYSDATE()-INTERVAL 6 MONTH
)

SELECT
    cm.month,
    case
        when _clt.med_change_lead_time is null then 0
        else _clt.med_change_lead_time/60 end as med_change_lead_time_in_hour
FROM
    _calendar_months cm
    left join _clt on cm.month = _clt.month
ORDER BY 1
If you want to measure in which category your team falls into as the picture shown below, run the following SQL in Grafana.

with _pr_stats as (
-- get PRs' cycle time in the selected period
    SELECT
        pr.id,
        pr.change_timespan as pr_cycle_time
    FROM
        pull_requests pr
    WHERE
        pr.merged_date is not null
        and pr.change_timespan is not null
        and $__timeFilter(pr.merged_date)
),

_median_change_lead_time as (
-- use median PR cycle time as the median change lead time
    SELECT x.pr_cycle_time as median_change_lead_time from _pr_stats x, _pr_stats y
    GROUP BY x.pr_cycle_time
    HAVING SUM(SIGN(1-SIGN(y.pr_cycle_time-x.pr_cycle_time)))/COUNT(*) > 0.5
    LIMIT 1
)

SELECT
  CASE
    WHEN median_change_lead_time < 60 then "Less than one hour"
    WHEN median_change_lead_time < 7 * 24 * 60 then "Less than one week"
    WHEN median_change_lead_time < 180 * 24 * 60 then "Between one week and six months"
    ELSE "More than six months"
    END as median_change_lead_time
FROM _median_change_lead_time
How to improve?
- Break requirements into smaller, more manageable deliverables
- Optimize the code review process
- "Shift left", start QA early and introduce more automated tests
- Integrate CI/CD tools to automate the deployment process