DORA - Median Time to Restore Service
What is this metric?
The time to restore service after service incidents, rollbacks, or any type of production failure happened.
Why is it important?
This metric is essential to measure the disaster control capability of your team and the robustness of the software.
Which dashboard(s) does it exist in
DORA dashboard. See live demo.
How is it calculated?
MTTR = The median incident age of all incidents.
If you have three incidents that happened in the given data range, one lasting 1 hour, one lasting 3 hours and one lasting 4 hours. Your MTTR will be: median(1, 3, 4) = 3 hours.
Below are the 2023 DORA benchmarks for different development teams from Google's report. However, it's difficult to tell which group a team falls into when the team's median time to restore service is between one week and six months. Therefore, DevLake provides its own benchmarks to address this problem:
| Groups | Benchmarks | DevLake Benchmarks |
|---|---|---|
| Elite performers | Less than one hour | Less than one hour |
| High performers | Less than one day | Less than one day |
| Medium performers | Between one day and one week | Between one day and one week |
| Low performers | More than six months | More than one week |
Click to expand or collapse 2021 DORA benchmarks
| Groups | Benchmarks | DevLake Benchmarks |
|---|---|---|
| Elite performers | Less than one hour | Less than one hour |
| High performers | Less than one day | Less than one day |
| Medium performers | Between one day and one week | Between one day and one week |
| Low performers | More than six months | More than one week |
Source: 2021 Accelerate State of DevOps, Google
Data Sources Required
Incidentsfrom Jira issues, GitHub issues, TAPD issues, PagerDuty Incidents, etc.
Define incident in data transformations while configuring the blueprint of a project to let DevLake know what CI/issue records can be regarded as deployments or incidents.
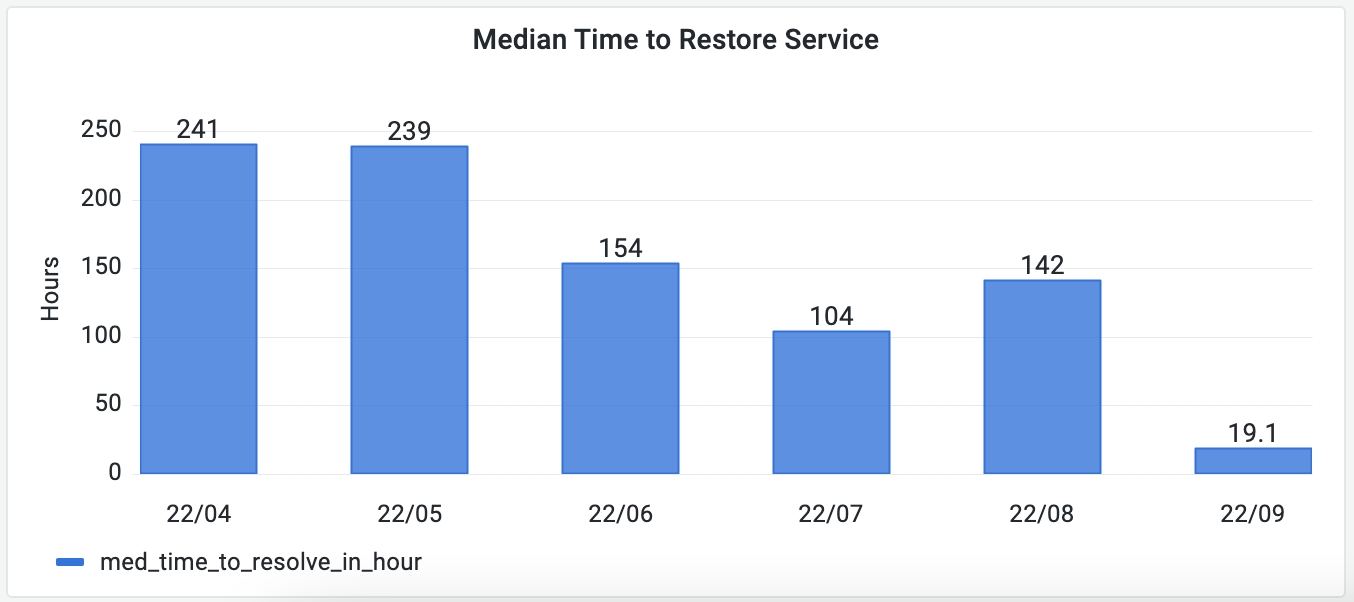
If you want to measure the monthly trend of the Median Time to Restore Service as the picture shown below, run the following SQL in Grafana.
-- Metric 3: median time to restore service - MTTR
-- Metric 3: median time to restore service - MTTR
with _incidents as (
-- get the number of incidents created each month
    SELECT
      distinct i.id,
        date_format(i.created_date,'%y/%m') as month,
        cast(lead_time_minutes as signed) as lead_time_minutes
    FROM
        issues i
      join board_issues bi on i.id = bi.issue_id
      join boards b on bi.board_id = b.id
      join project_mapping pm on b.id = pm.row_id and pm.`table` = 'boards'
    WHERE
      pm.project_name in (${project:sqlstring}+'')
        and i.type = 'INCIDENT'
        and i.lead_time_minutes is not null
),

_find_median_mttr_each_month_ranks as(
    SELECT *, percent_rank() over(PARTITION BY month order by lead_time_minutes) as ranks
    FROM _incidents
),

_mttr as(
    SELECT month, max(lead_time_minutes) as median_time_to_resolve
    FROM _find_median_mttr_each_month_ranks
    WHERE ranks <= 0.5
    GROUP BY month
)

SELECT
    cm.month,
    case
        when m.median_time_to_resolve is null then 0
        else m.median_time_to_resolve/60 end as median_time_to_resolve_in_hour
FROM
    calendar_months cm
    LEFT JOIN _mttr m on cm.month = m.month
  WHERE $__timeFilter(cm.month_timestamp)
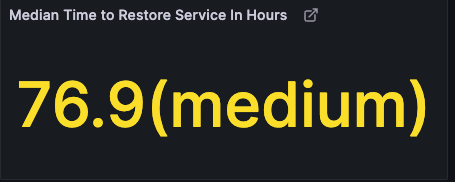
If you want to measure in which category your team falls into as in the picture shown below, run the following SQL in Grafana.
--  ***** 2023 report ***** --
--  Metric 4: Failed deployment recovery time
with _incidents as (
-- get the incidents created within the selected time period in the top-right corner
    SELECT
      distinct i.id,
        cast(lead_time_minutes as signed) as lead_time_minutes
    FROM
        issues i
      join board_issues bi on i.id = bi.issue_id
      join boards b on bi.board_id = b.id
      join project_mapping pm on b.id = pm.row_id and pm.`table` = 'boards'
    WHERE
      pm.project_name in (${project})
        and i.type = 'INCIDENT'
        and $__timeFilter(i.created_date)
),

_median_mttr_ranks as(
    SELECT *, percent_rank() over(order by lead_time_minutes) as ranks
    FROM _incidents
),

_median_mttr as(
    SELECT max(lead_time_minutes) as median_time_to_resolve
    FROM _median_mttr_ranks
    WHERE ranks <= 0.5
),

_metric_mttr_2021_report as(
    SELECT
    CASE
        WHEN ('$dora_report') = '2021' THEN
            CASE
                WHEN median_time_to_resolve < 60 THEN CONCAT(round(median_time_to_resolve/60,1), "(elite)")
                WHEN median_time_to_resolve < 24 * 60 THEN CONCAT(round(median_time_to_resolve/60,1), "(high)")
                WHEN median_time_to_resolve < 7 * 24 * 60 THEN CONCAT(round(median_time_to_resolve/60,1), "(medium)")
                WHEN median_time_to_resolve >= 7 * 24 * 60 THEN CONCAT(round(median_time_to_resolve/60,1), "(low)")
                ELSE "N/A. Please check if you have collected incidents."
            END
    END AS median_time_to_resolve
    FROM
        _median_mttr
)

SELECT
  median_time_to_resolve AS median_time_to_resolve
FROM
  _metric_mttr_2021_report
WHERE
  ('$dora_report') = '2021'
How to improve?
- Use automated tools to quickly report failure
- Prioritize recovery when a failure happens
- Establish a go-to action plan to respond to failures immediately
- Reduce the deployment time for failure-fixing