DORA - Change Failure Rate
What is this metric?
The percentage of changes that were made to a code that then resulted in incidents, rollbacks, or any type of production failure.
Why is it important?
Unlike Deployment Frequency and Lead Time for Changes that measure the throughput, Change Failure Rate measures the stability and quality of software delivery. A high CFR reflects a bad end-user experience as the production failure is relatively high.
Which dashboard(s) does it exist in
DORA dashboard. See live demo.
How is it calculated?
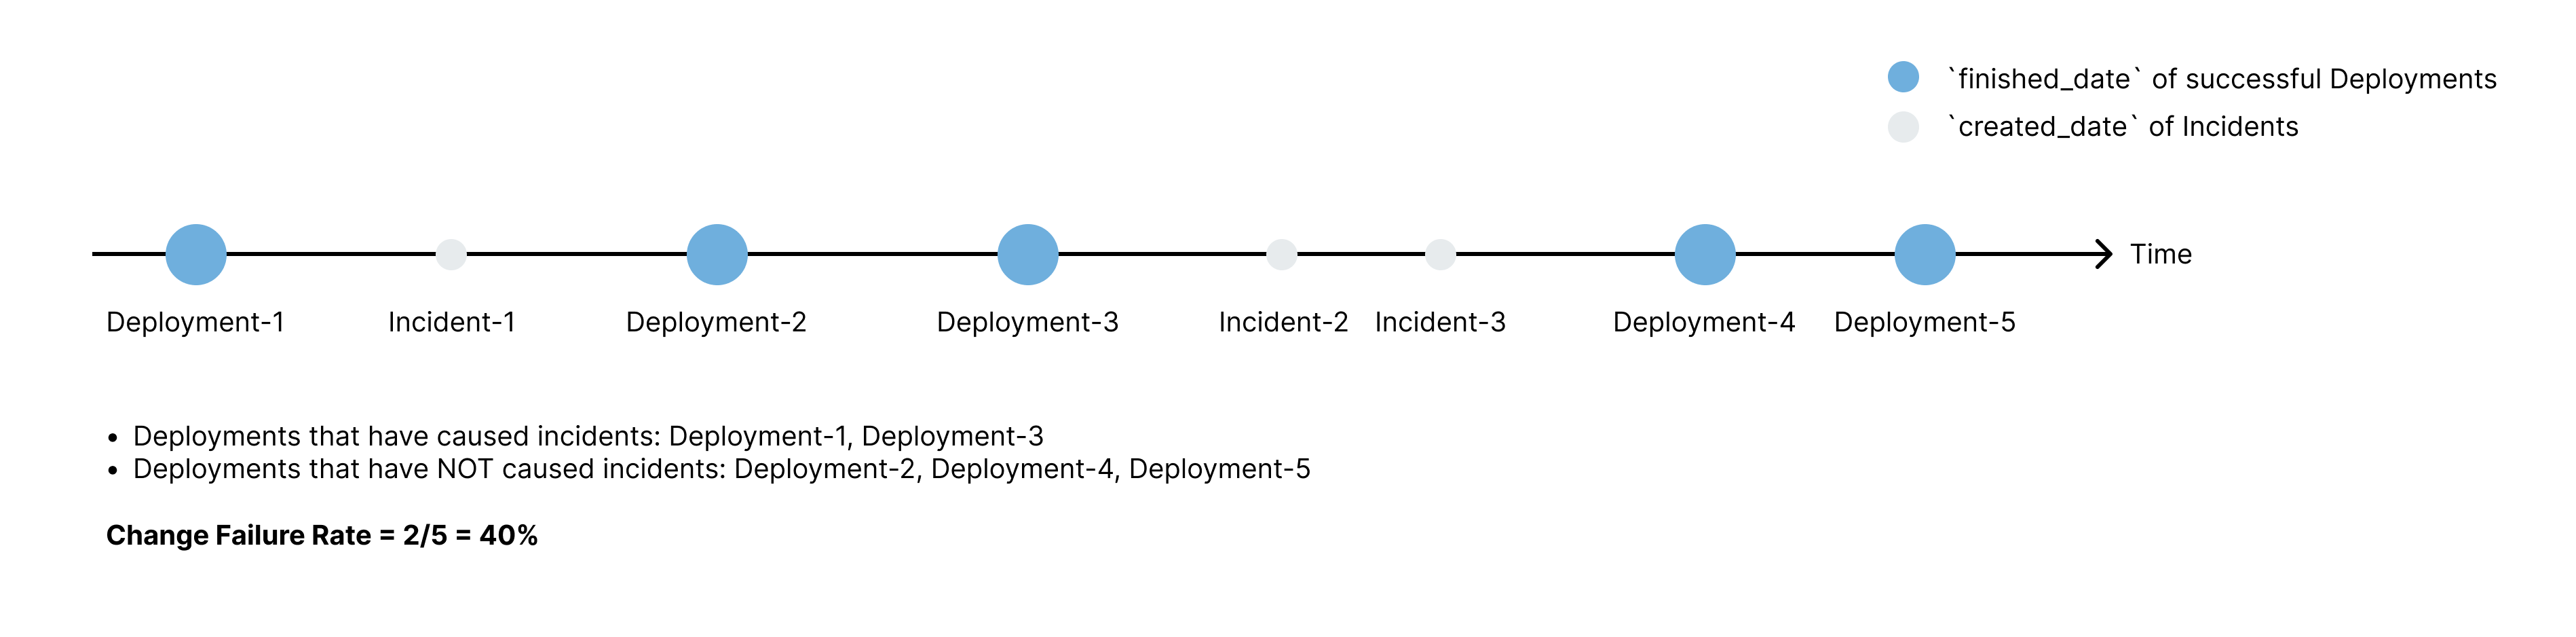
The number of deployments affected by incidents/total number of deployments. For example, if there are five deployments and two deployments cause one or more incidents, that is a 40% change failure rate.
When there are multiple deployments triggered by one pipeline, tools like GitLab and BitBucket will generate more than one deployment. In these cases, DevLake will consider these deployments as ONE deployment and use the last deployment's finished date as the deployment finished date.
Below are the 2023 DORA benchmarks for different development teams from Google's report. However, it's difficult to tell which group a team falls into when the team's change failure rate is between 15% and 64%. Therefore, DevLake provides its own benchmarks to address this problem:
| Groups | Benchmarks | DevLake Benchmarks |
|---|---|---|
| Elite performers | 5% | (0, 5%] |
| High performers | 10% | (5%, 10%] |
| Medium performers | 15% | (10%, 15%] |
| Low performers | 64% | (15%, 100%] |
Click to expand or collapse 2021 DORA benchmarks
| Groups | Benchmarks | DevLake Benchmarks |
|---|---|---|
| Elite performers | 0%-15% | (0, 15%] |
| High performers | 16%-30% | (16%, 20%] |
| Medium performers | 16%-30% | (21%, 30%] |
| Low performers | 16%-30% | (30%, 100%] |
Source: 2021 Accelerate State of DevOps, Google
Data Sources Required
Deploymentsfrom Jenkins, GitLab CI, GitHub Action, BitBucket Pipelines, or Webhook, etc.Incidentsfrom Jira issues, GitHub issues, TAPD issues, PagerDuty Incidents, etc.
Define deployment and incident in data transformations while configuring the blueprint of a project to let DevLake know what CI/issue records can be regarded as deployments or incidents.
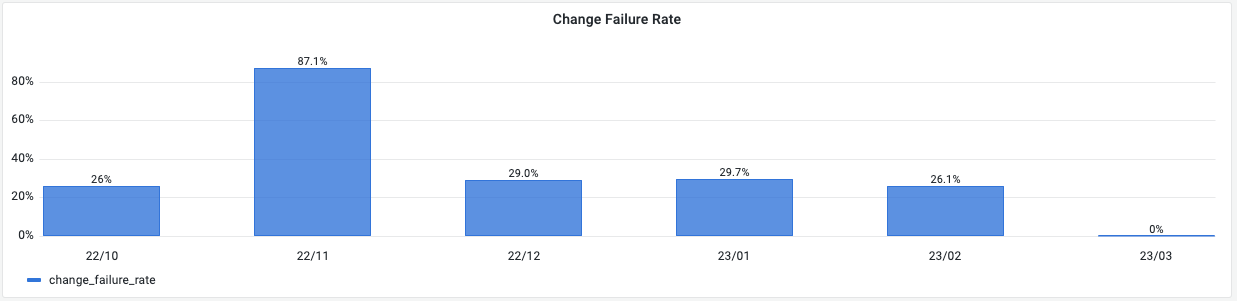
If you want to measure the monthly trend of Change Failure Rate, run the following SQL in Grafana.
-- Metric 4: change failure rate per month
with _deployments as (
-- When deploying multiple commits in one pipeline, GitLab and BitBucket may generate more than one deployment. However, DevLake consider these deployments as ONE production deployment and use the last one's finished_date as the finished date.
    SELECT
        cdc.cicd_deployment_id as deployment_id,
        max(cdc.finished_date) as deployment_finished_date
    FROM
        cicd_deployment_commits cdc
        JOIN project_mapping pm on cdc.cicd_scope_id = pm.row_id and pm.`table` = 'cicd_scopes'
    WHERE
        pm.project_name in (${project:sqlstring}+'')
        and cdc.result = 'SUCCESS'
        and cdc.environment = 'PRODUCTION'
    GROUP BY 1
    HAVING $__timeFilter(max(cdc.finished_date))
),

_failure_caused_by_deployments as (
-- calculate the number of incidents caused by each deployment
    SELECT
        d.deployment_id,
        d.deployment_finished_date,
        count(distinct case when i.type = 'INCIDENT' then d.deployment_id else null end) as has_incident
    FROM
        _deployments d
        left join project_issue_metrics pim on d.deployment_id = pim.deployment_id
        left join issues i on pim.id = i.id
    GROUP BY 1,2
),

_change_failure_rate_for_each_month as (
    SELECT
        date_format(deployment_finished_date,'%y/%m') as month,
        case
            when count(deployment_id) is null then null
            else sum(has_incident)/count(deployment_id) end as change_failure_rate
    FROM
        _failure_caused_by_deployments
    GROUP BY 1
)

SELECT
    cm.month,
    cfr.change_failure_rate
FROM
    calendar_months cm
    LEFT JOIN _change_failure_rate_for_each_month cfr on cm.month = cfr.month
    WHERE $__timeFilter(cm.month_timestamp)
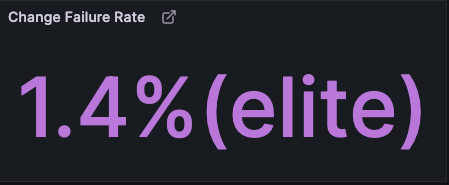
If you want to measure in which category your team falls, run the following SQL in Grafana.
-- Metric 3: change failure rate
with _deployments as (
-- When deploying multiple commits in one pipeline, GitLab and BitBucket may generate more than one deployment. However, DevLake consider these deployments as ONE production deployment and use the last one's finished_date as the finished date.
    SELECT
        cdc.cicd_deployment_id as deployment_id,
        max(cdc.finished_date) as deployment_finished_date
    FROM
        cicd_deployment_commits cdc
        JOIN project_mapping pm on cdc.cicd_scope_id = pm.row_id and pm.`table` = 'cicd_scopes'
    WHERE
        pm.project_name in (${project})
        and cdc.result = 'SUCCESS'
        and cdc.environment = 'PRODUCTION'
    GROUP BY 1
    HAVING $__timeFilter(max(cdc.finished_date))
),

_failure_caused_by_deployments as (
-- calculate the number of incidents caused by each deployment
    SELECT
        d.deployment_id,
        d.deployment_finished_date,
        count(distinct case when i.type = 'INCIDENT' then d.deployment_id else null end) as has_incident
    FROM
        _deployments d
        left join project_issue_metrics pim on d.deployment_id = pim.deployment_id
        left join issues i on pim.id = i.id
    GROUP BY 1,2
),

_change_failure_rate as (
    SELECT
        case
            when count(deployment_id) is null then null
            else sum(has_incident)/count(deployment_id) end as change_failure_rate
    FROM
        _failure_caused_by_deployments
),

_is_collected_data as(
    SELECT
        CASE
        WHEN COUNT(i.id) = 0 AND COUNT(cdc.id) = 0 THEN 'No All'
        WHEN COUNT(i.id) = 0 THEN 'No Incidents'
        WHEN COUNT(cdc.id) = 0 THEN 'No Deployments'
        END AS is_collected
FROM
    (SELECT 1) AS dummy
LEFT JOIN
    issues i ON i.type = 'INCIDENT'
LEFT JOIN
    cicd_deployment_commits cdc ON 1=1
)


SELECT
  CASE
    WHEN ('$dora_report') = '2023' THEN
            CASE
                WHEN is_collected = "No All"  THEN "N/A. Please check if you have collected deployments/incidents."
                WHEN is_collected = "No Incidents"  THEN "N/A. Please check if you have collected incidents."
                WHEN is_collected = "No Deployments"  THEN "N/A. Please check if you have collected deployments."
                WHEN change_failure_rate <= .05 THEN CONCAT(round(change_failure_rate*100,1), "%(elite)")
                WHEN change_failure_rate <= .10 THEN CONCAT(round(change_failure_rate*100,1), "%(high)")
                WHEN change_failure_rate <= .15 THEN CONCAT(round(change_failure_rate*100,1), "%(medium)")
                WHEN change_failure_rate > .15 THEN CONCAT(round(change_failure_rate*100,1), "%(low)")
                ELSE "N/A. Please check if you have collected deployments/incidents."
                END
        WHEN ('$dora_report') = '2021' THEN
            CASE
              WHEN is_collected = "No All"  THEN "N/A. Please check if you have collected deployments/incidents."
                WHEN is_collected = "No Incidents"  THEN "N/A. Please check if you have collected incidents."
                WHEN is_collected = "No Deployments"  THEN "N/A. Please check if you have collected deployments."
                WHEN change_failure_rate <= .15 THEN CONCAT(round(change_failure_rate*100,1), "%(elite)")
                WHEN change_failure_rate <= .20 THEN CONCAT(round(change_failure_rate*100,1), "%(high)")
                WHEN change_failure_rate <= .30 THEN CONCAT(round(change_failure_rate*100,1), "%(medium)")
                WHEN change_failure_rate > .30 THEN CONCAT(round(change_failure_rate*100,1), "%(low)")
                ELSE "N/A. Please check if you have collected deployments/incidents."
                END
        ELSE 'Invalid dora report'
    END AS change_failure_rate
FROM
    _change_failure_rate, _is_collected_data
How to improve?
- Add unit tests for all new feature
- "Shift left", start QA early and introduce more automated tests
- Enforce code review if it's not strictly executed